MonitorIQ® Desktop Geotechnical Software
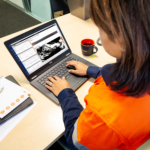
MonitorIQ® Desktop is our dedicated geotechnical analysis platform and the standard platform across all our systems and sensors.
For over twenty years, our industry-proven MonitorIQ® Desktop software has provided rapid, precise data analysis to detect trends and the ability to send alerts for immediate action.
Key Features:
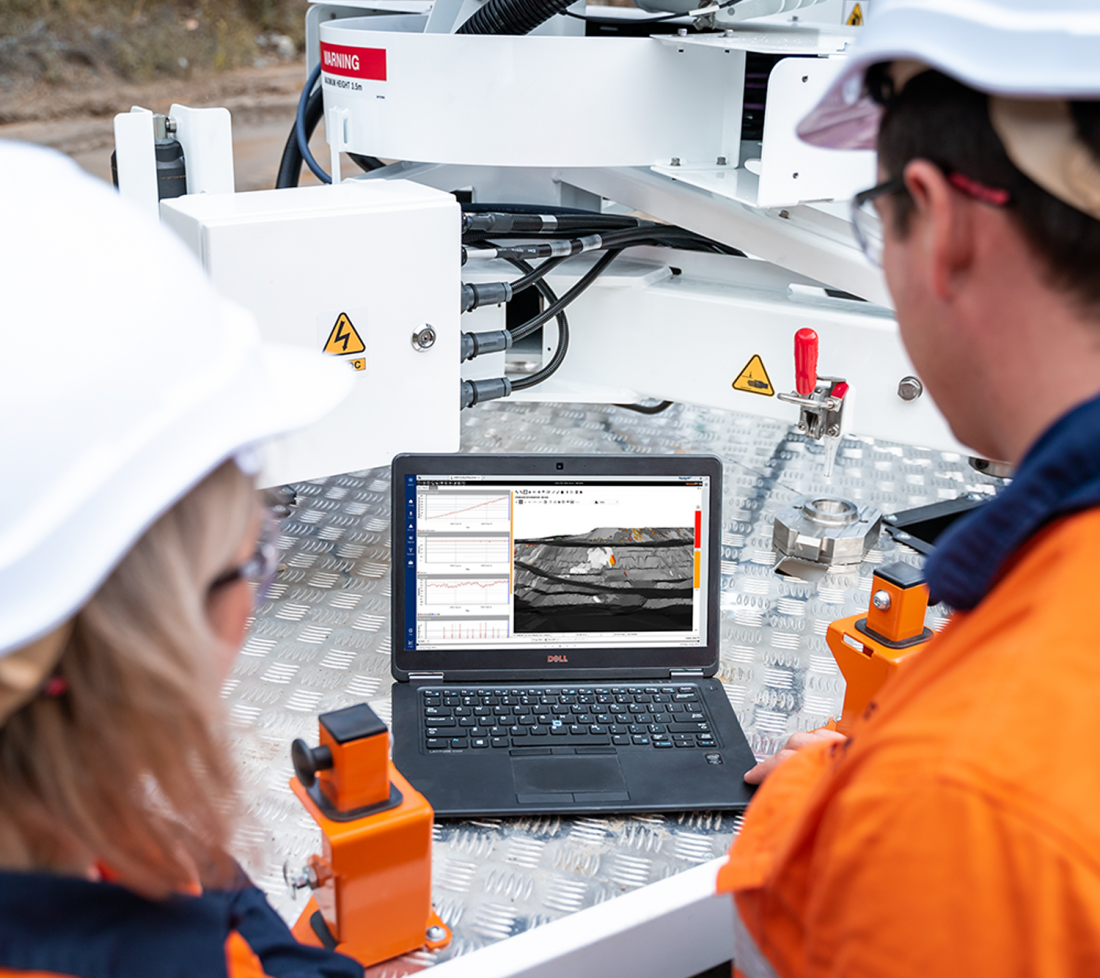
With MonitorIQ® Desktop 2024’s Dual-Radar View, you can seamlessly analyse data from two GroundProbe radars within a single interface, eliminating the need to switch between tabs or views. This unified view enhances the user experience by consolidating essential information, making it easier to pinpoint specific georeferenced walls for analysis. You can select data for each radar, allowing for efficient and tailored analysis.
Designed for continuous monitoring, this feature aids in understanding long-term behaviour and identifying root causes. It also ensures precise radar placement and comprehensive monitoring of risk areas, providing critical context to protect vital infrastructure and maintain operational safety.
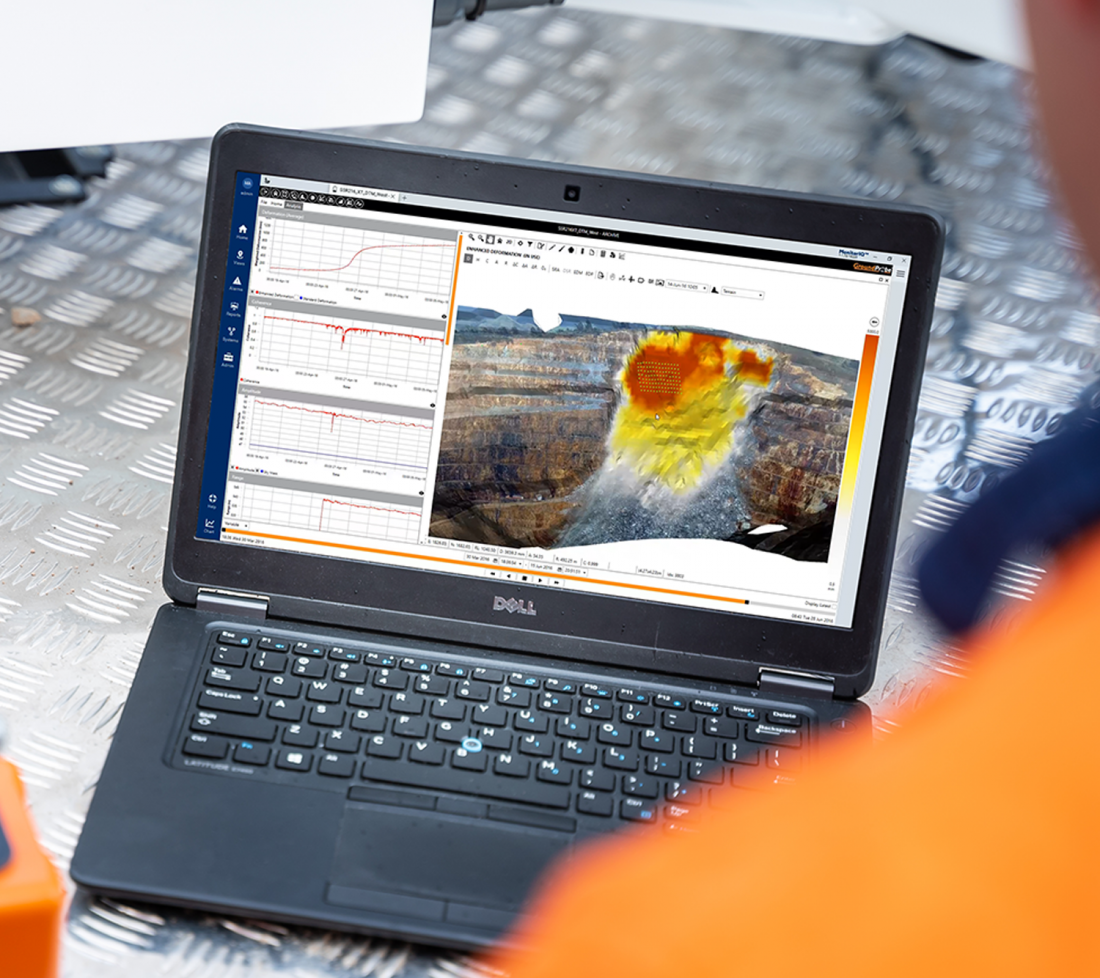
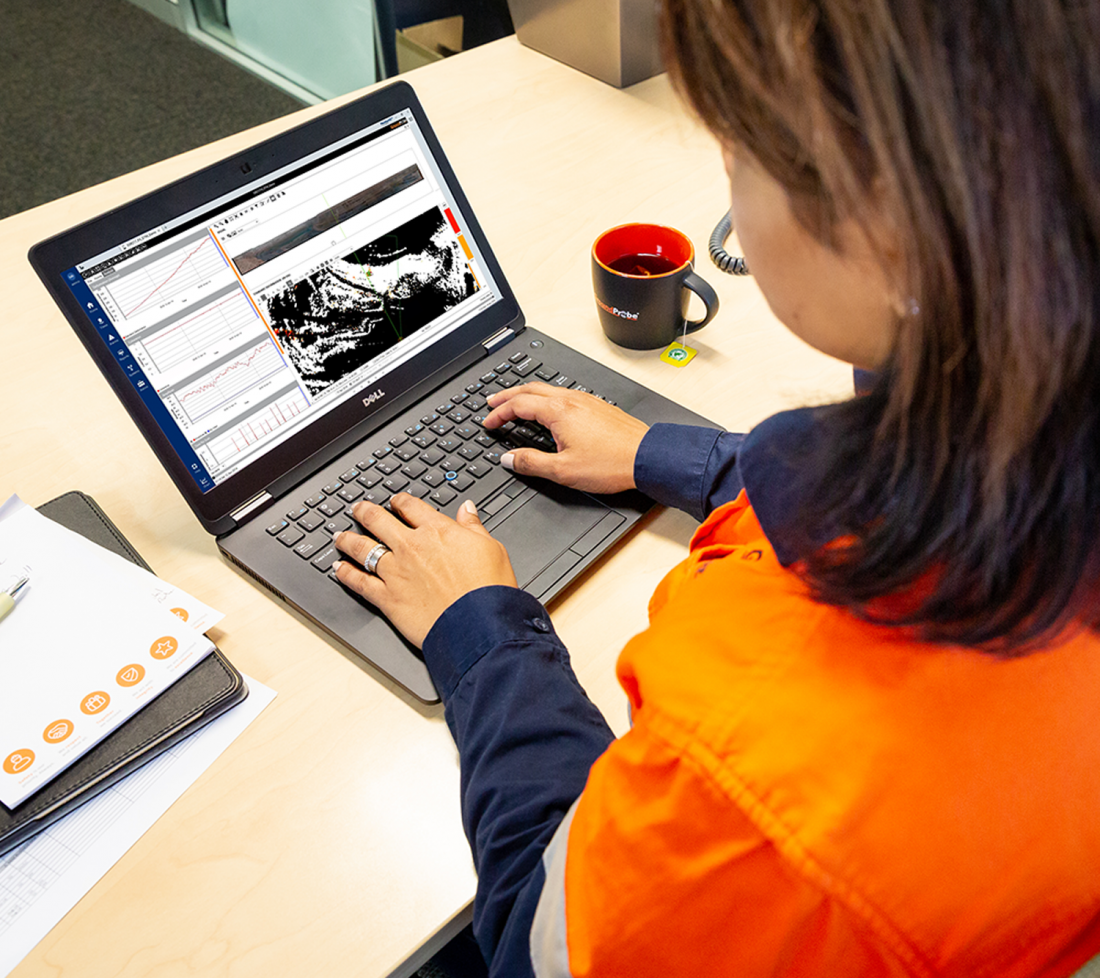
MonitorIQ® Desktop merges radar data with digital terrain maps (DTMs), enabling precise data analysis relative to 3D mine geometry. Enhanced alignment and simplified data selection facilitate quick figure creation to understand mine operations better.
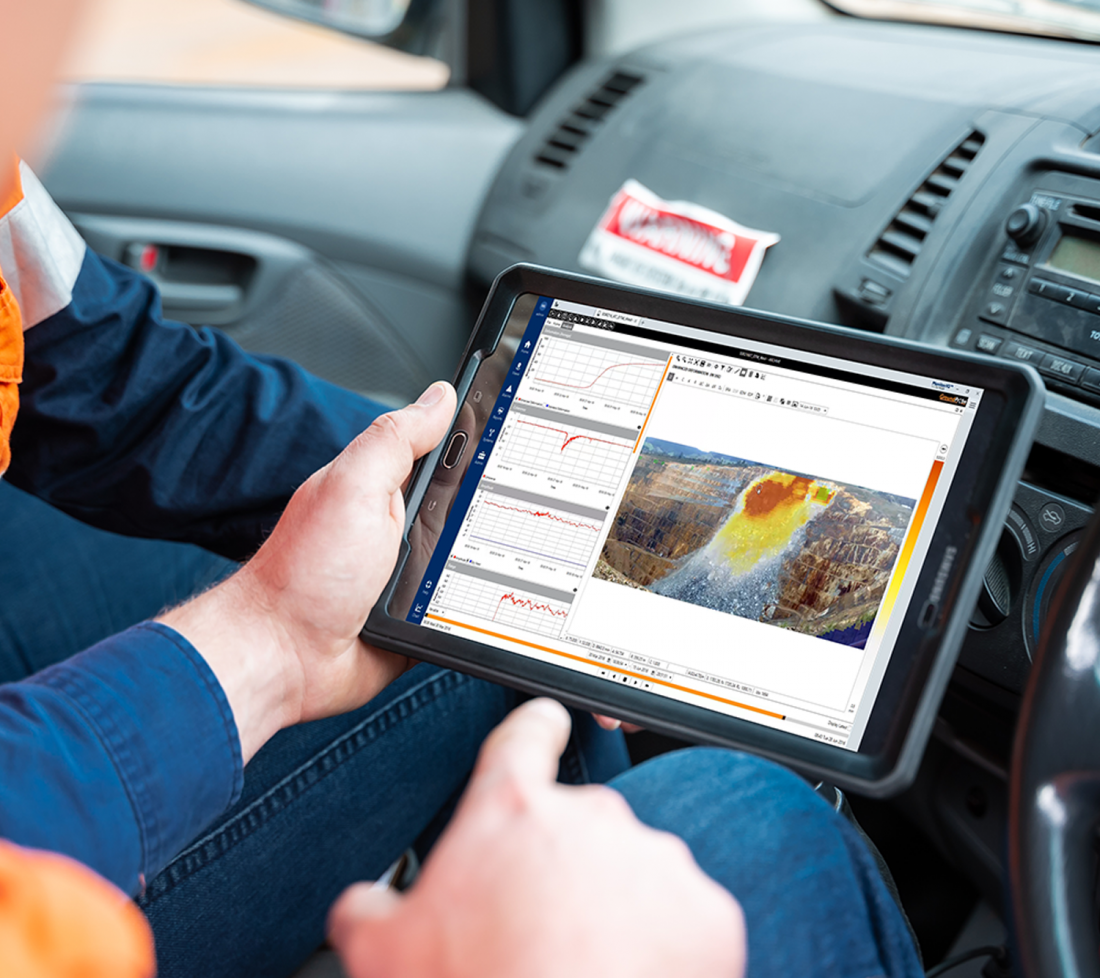
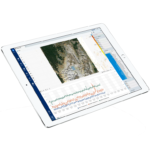
Overlaying images through deformation heatmaps captured by our monitoring hardware and imported into MonitorIQ® Desktop, users can click on any part of the data for live movement assessment, resulting in advanced, precise, user-friendly real-time monitoring analysis.
GroundProbe’s Precision Atmospherics® is a revolutionary atmospheric correction algorithm that distinguishes and significantly reduces the noise in Slope Stability Radar (SSR) data, inherently caused by changing atmospheric conditions. It is currently available on our 2D-Real Aperture Radars: SSR-FX and SSR-Omni.
A powerful analysis and charting tool, inverse velocity forecasts the time of the collapse, giving users the confidence to make timely decisions crucial to the safety and operation of their mine.
Featuring an extensive charting library with an array of powerful tools, users can correlate data to identify trends, whilst reducing the clutter of data. Furthermore, the custom analysis tab allows you to view multiple types of data on a single, easily configurable chart. Practical reporting tools then help report the findings.
Product features and videos
Downloads and Resources

Related Products
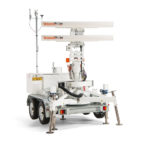
RGR-Velox
REACTIVE MONITORING AND ALARMING SOLUTION
The RGR-Velox (Reactive Geohazard Radar) is a ...
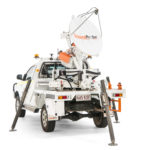
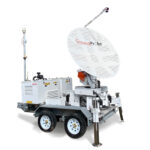
SSR-Agilis
TACTICAL, HIGHLY-MOBILE SOLUTION
The SSR-Agilis is a standalone vehicle monitoring ...
MonitorIQ® Enterprise Geotechnical Software
Designed and developed by geotechnical engineers for geotechnical engineers, MonitorIQ® ...
More
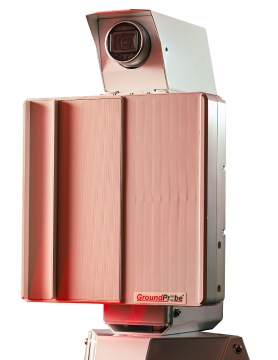
SSR-Omni
FULL-COVERAGE, HIGH-RESOLUTION SOLUTION
The SSR-Omni is a full-coverage, high-resolution ...
SSR-SARx
HIGH RESOLUTION, LONG-RANGE SOLUTION
Designed to identify long-range risks and hazards, ...